


Recent Announcement
NOTICE TO OIL AND GAS OPERATORS
RRC Launches Lonestar For Schedule A Authorized Pits Online Registration
July 09, 2026Read More Announcements

Railroad Commission of Texas
Our mission is to serve Texas by our stewardship of natural resources and the environment, our concern for personal and community safety, and our support of enhanced development and economic vitality for the benefit of Texans.
Emergency Management
Texas Energy on Track Podcast
RRC Awards
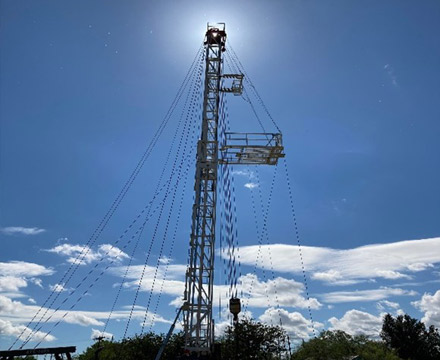
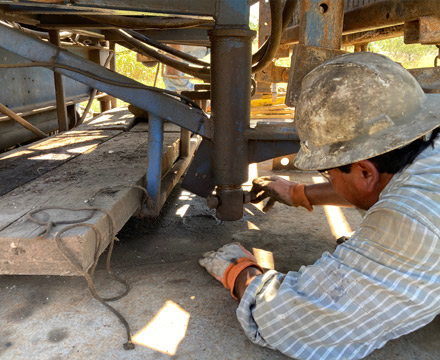
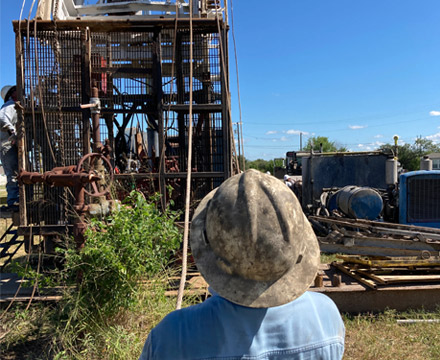
Work in the Field
Recent News
Geothermal Energy Gains Ground in Texas Under RRC Leadership
AUSTIN – While best known as the oil and gas regulator for the Lone Star State, the RRC also has statutory responsibilities for other areas of the energy industry, including Texas’ growing geothermal sector.
With significant overlap in technology and expertise with the oil and gas industry, geothermal development benefits from the RRC’s established regulatory framework and team of experts. The Commission plays an important role in keeping geothermal projects compliant with rigorous environmental and safety standards as the industry continues to develop in Texas.
In February 2025, the RRC issued its first permit for a deep geopressured geothermal well to Sage Geosystems in Atascosa County. The project will provide energy storage for the San Miguel Electric Cooperative and its customers.
This month, the Commission issued its second permit for a deep geopressured geothermal well for energy storage to Quidnet Energy Deployment LLC for a well located in Galveston County.
The issuance of the second permit highlights the continued growth of geothermal development in Texas and the RRC’s role in supporting the safe and responsible advancement of emerging technologies.
“Since assuming jurisdiction over geothermal well regulations from the Texas Commission on Environmental Quality in September 2023, the RRC has remained committed to taking a deliberate permitting approach that supports the responsible growth of this new technology,” said RRC Executive Director Wei Wang. “This work in geothermal energy is yet another example of how the RRC’s expertise in responsible subsurface regulation helps keep Texas at the forefront of energy development.”
The Commission has also seen a significant growth in the average number of shallow closed-loop geothermal wells. These systems use the earth as a heat sink to help heat or cool a building, providing an efficient option for indoor climate control. Local independent school districts are increasingly adopting the technology to help meet their heating and cooling needs.
During fiscal years 2024 and 2025, approximately 1,400 shallow geothermal wells were completed each year. In the current fiscal year alone, 3,162 wells have been drilled and completed at 39 sites across Texas.
This rapid expansion reflects both the growing interest in geothermal technology and the effectiveness of the RRC’s regulatory approach. The growth is due in part to a new shallow geothermal rule that clarified regulatory roles and activities without increasing the agency's permitting fees or staffing requirements. This has helped create a clear, efficient regulatory pathway for the continued development of this new emerging technology.
For more on the RRC’s geothermal permitting process, visit: https://www.rrc.texas.gov/oil-and-gas/applications-and-permits/injection-storage-permits/geothermal/
View All News