


Recent Announcement
NOTICE TO OIL AND GAS OPERATORS
RRC Launches Lonestar For Schedule A Authorized Pits Online Registration
July 09, 2026Read More Announcements

Railroad Commission of Texas
Our mission is to serve Texas by our stewardship of natural resources and the environment, our concern for personal and community safety, and our support of enhanced development and economic vitality for the benefit of Texans.
Emergency Management
Texas Energy on Track Podcast
RRC Awards
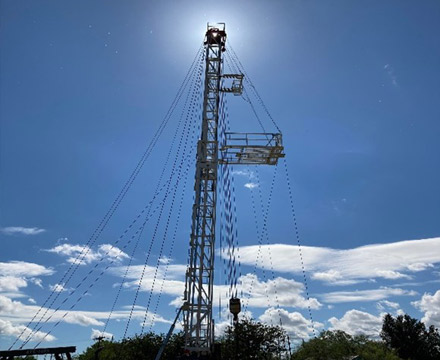
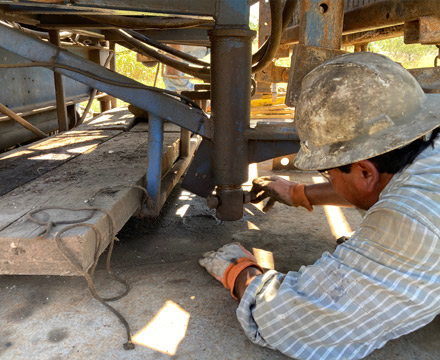
Work in the Field
Recent News
RRC and Texas Tech Build Partnership to Strengthen Oil and Gas Inspector Training
The collaboration will equip state inspectors with hands-on experience through a partnership between Texas Tech’s Department of Petroleum Engineering and the RRC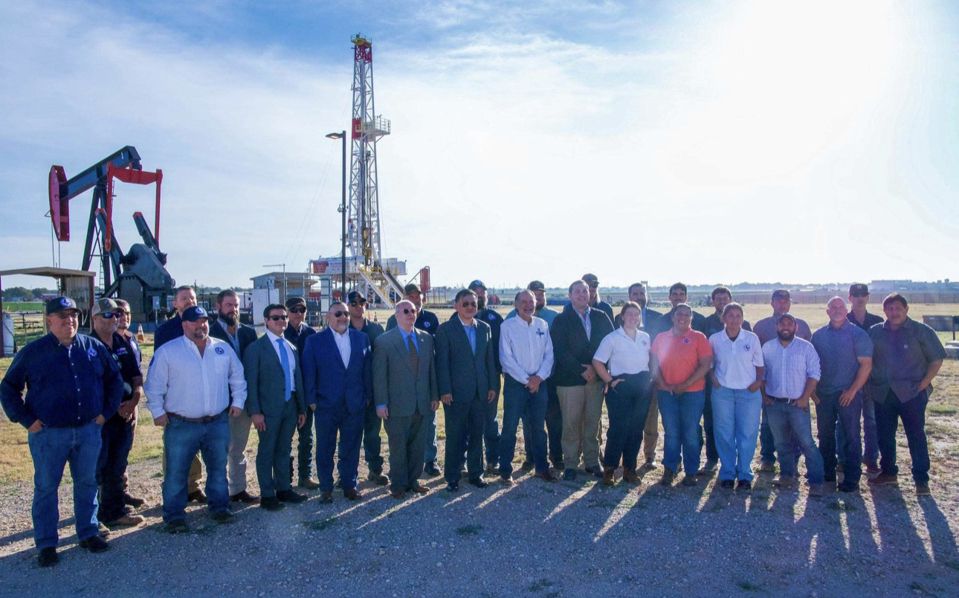
RRC leadership and staff stand alongside members of Texas Tech University’s Bob L. Herd Department of Petroleum Engineering at the launch of the RRC Field Inspector Training program held at the school's Oilfield Technology Center in Lubbock.
AUSTIN – As part of its ongoing effort to further strengthen staff expertise, the RRC has partnered with Texas Tech University’s Bob L. Herd Department of Petroleum Engineering to launch the RRC Field Inspector Training program, a new initiative designed to enhance the professional development of the Commission’s oil and gas inspectors.
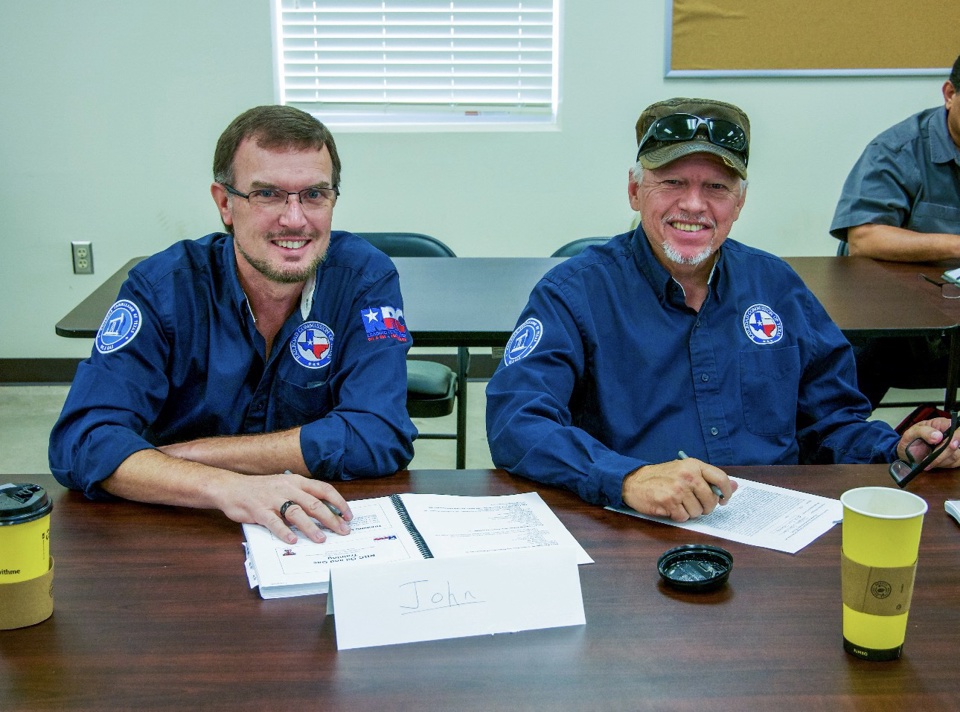
After nearly a year of development and coordination, the first class of inspectors attended the four-day course held July 27-30 at the school’s Oilfield Technology Center in Lubbock. The new program represents a major advancement for the RRC, eliminating the need for inspectors to travel out of state for this specialized training by bringing it to Texas for the first time.
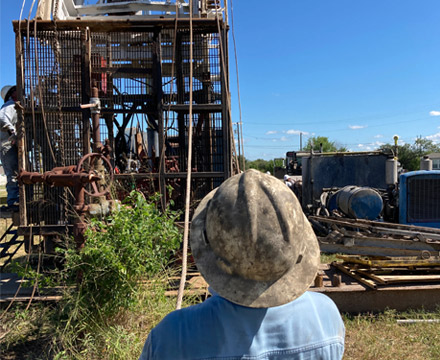
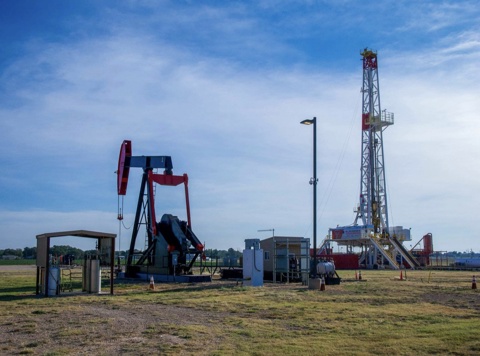
The state-of-the-art center features a dedicated classroom, a shop equipped with oil and gas equipment cutaways and models and an outdoor training space with production facilities, a pumping unit, gas compressors and a drilling rig.
The course provides new or early-career inspectors with an enhanced, hands-on learning experience designed to help them better understand the equipment and environment that they will encounter in the field. Utilizing the world-class educational tools available at the facility, the training includes demonstrations of a variety of equipment, including the center’s fully functional drilling rig, as well as training sessions covering key stages of a well’s lifecycle, such as cementing, blowout prevention and well plugging.
“This training program further strengthens our field inspectors by providing them with the skills and knowledge needed to perform their jobs at the highest level,” said Wei Wang, Executive Director of the RRC. “Partnerships among Texas institutions are critical to advancing the work we do and serving the people of our state. We are proud to partner with Texas Tech to enhance inspector training and help ensure the continued protection of Texas’ natural resources and communities. I thank Texas Tech for their commitment to this important effort.”
During the inaugural course, RRC leadership traveled from Austin to observe the training and heard from Dr. Marshall Watson, Chair of the Bob L. Herd Department of Petroleum Engineering.
“This partnership represents a meaningful step forward in how we connect education, industry and regulation,” said Watson. “By providing hands-on training in a realistic environment, we’re helping inspectors build the skills they need to ensure safe and efficient energy operations across Texas.”
While this course is tailored specifically for oil and gas inspectors, RRC Training Development is currently crafting a similar course for inspectors in the Commission’s Critical Infrastructure Division.
View All News